Using Grafana to make a web kiosk, with pictures from a network share or external site
Grafana has a playlist mode that lets you rotate through a series of dashboards. We set up a screen in our IT department, to show live stats for our web traffic and API calls per day, etc.
This drew interest from others in management, who wanted a simple way to sprinkle in their own announcements and pictures in with the graphs. Some would publish their info to a website, while others would save their media to a network share.
Step 1: Pick a network share or website to host your images from
You can host your pictures on any site that the Grafana server can reach. The more interesting case is pulling them from a network share, if you want Grafana to serve out the info directly.
Create a new folder or share on your Network Storage, that is accessible to both your Grafana server and the people you want updating the content. Ensure that user permissions are appropriate for your situation. In this example, we will use a Windows (SMB) share with the folder path:
\\storage.company.com\Techology_Services\Kiosk
Step 2: Mount the network share on your Grafana server, and symlink it into Grafana’s public/ folder
Skip this step if you are hosting the images from a website or Content Management System.
Mount the share from Grafana on Windows
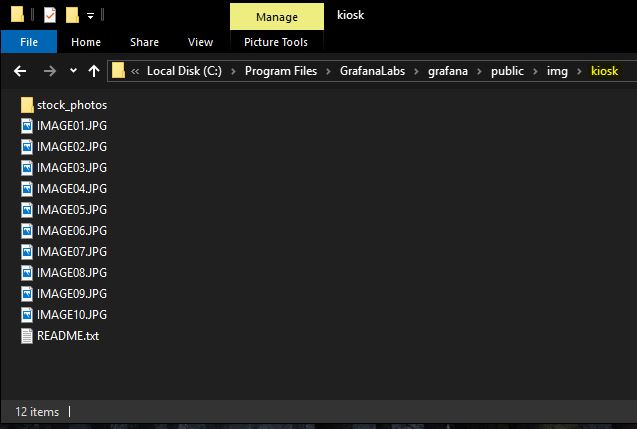
- Locate the public image folder on your Grafana installation directory:
C:\Program Files\GrafanaLabs\grafana\public\img - Open a command prompt as administrator. Use the mklink command to create a symbolic link called ‘kiosk’, that maps to your network folder. It must reside somewhere under \public\. NOTE: This may require some Group Policy changes, if your organization restricts remote symlinks via Group Policy.
mklink /D "C:\Program Files\GrafanaLabs\grafana\public\img\kiosk" "\\storage.company.com\Techology_Services\Kiosk" - Verify your network share is accessible through the symbolic link.
Mount the share from Grafana on Linux
- Ensure you have installed the appropriate package for mounting network shares: cifs-utils (SMB) or nfs-utils (NFS).
- Redhat/CentOS:
sudo yum install cifs-utils; sudo yum install nfs-utils - Ubuntu:
sudo apt install cifs-utils; sudo apt install nfs-utils
- Redhat/CentOS:
- Create a folder to use as a mountpoint in Grafana’s public images directory, under /usr/share/grafana/public/img/ . Do NOT modify any existing content there!
mkdir /usr/share/grafana/public/img/kiosk - Add an entry in your /etc/fstab file, to mount your network share into this new folder. You should only need read permissions on the share. Your mount entry will look different depending on the share type, NFS or SMB/CIFS.
- NFS example:
storage.company.com:/vol/Public/Technology_Services/Kiosk /usr/share/grafana/public/img/kiosk nfs nolock,rw,bg,hard,intr 0 0 - SMB example:
//storage.company.com/Technology_Services/Kiosk /usr/share/grafana/public/img/kiosk cifs credentials=/root/smb.creds 0 0SMB note: Above example uses credentials stored in a file under /root/smb.creds, looking something like:
username=user_name
password=password
domain=domain_name
- NFS example:
- Mount your network share now, and verify that you can see the pictures from your share.
mount /usr/share/grafana/public/img/kiosk

[root@grafana ~\]$ ls -l /usr/share/grafana/public/img/kiosk
-rw-r--r-- 1 someuser somegroup  69170 Nov 28 01:56 IMAGE01.JPG
-rw-r--r-- 1 someuser somegroup  76855 Nov 28 01:38 IMAGE02.JPG
-rw-r--r-- 1 someuser somegroup 248888 Nov 28 02:01 IMAGE03.JPG
-rw-r--r-- 1 someuser somegroup 225343 Nov 28 02:59 IMAGE04.JPG
-rw-r--r-- 1 someuser somegroup 410667 Dec  4 10:28 IMAGE05.JPG
-rw-r--r-- 1 someuser somegroup  69170 Nov 28 01:56 IMAGE06.JPG
-rw-r--r-- 1 someuser somegroup  76855 Nov 28 01:38 IMAGE07.JPG
-rw-r--r-- 1 someuser somegroup 248888 Nov 28 02:01 IMAGE08.JPG
-rw-r--r-- 1 someuser somegroup 225343 Nov 28 02:59 IMAGE09.JPG
-rw-r--r-- 1 someuser somegroup 410667 Dec  4 10:28 IMAGE10.JPG
-rw-r--r-- 1 someuser somegroup   1786 Dec  4 10:23 README.txt
drwxr-xr-x 2 someuser somegroup   8192 Dec  4 10:28 stock_photos
Linux Bonus: mount the share with AutoFS
To make this mount more resilient against network outages, look into using AutoFS to automatically mount the share on-demand. The setup is a little more involved, but it makes the network mounts more resilient against storage maintenance, app updates, and network outages. Below shows an example configuration.
sudo yum install autofs || sudo apt install autofs
systemctl enable autofs
The master file:
[root@grafana ~]$ cat /etc/auto.master

/misc /etc/auto.misc
/net -hosts
+dir:/etc/auto.master.d
+auto.master
# Custom autofs share for Grafana dashboard kiosk
/usr/share/grafana/public/img/autofs   /etc/auto.kiosk --timeout=1800
Sample NFS automount:
[root@grafana ~]$ cat /etc/auto.kiosk

kiosk "storage.company.com:/vol/Public/Techology_Services/Kiosk"
Sample SMB automount, using a credentials file at /etc/kiosk.creds for access:
[root@grafana ~]$ cat /etc/auto.kiosk
kiosk  -fstype=cifs,rw,vers=1.0,noperm,credentials=/etc/kiosk.creds ://storage.company.com/Technology_Services/Kiosk
Do not create the local folders involved; autofs will do that for you. Share will be auto-mapped to:
/usr/share/grafana/public/img/autofs/kiosk
Step 3: Create Grafana dashboards that display the images from your share or website
- Log into your Grafana instance, go to Dashboards > Manage, and create a new dashboard.
- Create a new panel, with visualization type “Text”.
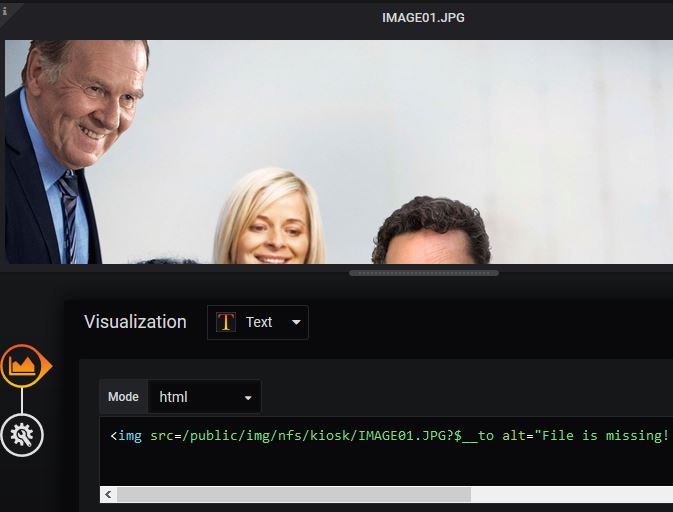
- Edit your text panel, and change the ‘Mode’ dropdown to html.
For images from a network share, paste in the local, relative file path of your image. This path is relative to Grafana’s built-in webserver /public directory (hence why we mounted the image share under there). See below for an example, I will explain the ?$__to in a bit.
<img src=/public/img/kiosk/IMAGE01.JPG?$__to alt="Nothing here yet, stay tuned for other announcements!">
If the image is hosted on an external site, provide the full URL of the image instead.
<img src=**https://sitename.company.com/public/images/IMAGE01.JPG?$__to alt="Nothing here yet, stay tuned for other announcements!">
Some important notes on the URL:
- The
?$__towill append the Grafana server’s epoch time to the end of the URL. This trick makes the URL unique to your kiosk’s web browser, so that every time a panel loads it will fetch the latest images (rather than caching it once, as browsers tend to do). This prevents your dashboard panels from showing an old / stale image, when someone swaps out one of the pictures on the share. - Grafana’s internal webserver supports most standard image formats: JPG, PNG, SVG, etc.
- Filenames and URLs are case-sensitive! You will have to train your users to watch out for this, sorry.
4. You should see the picture appear in the panel as soon as you provide a valid path. Edit your dashboard settings, and under the General tab > Tags, add a tag named “kiosk”- this will come in handy later. Save your dashboard.
Rinse and repeat, adding new image panels and/or dashboards as-needed.
Step 4: Make your Grafana playlist
In the Grafana GUI, go to Dashboards > Playlists, and click New playlist.
- Set your playlist Name and Interval (2m, 5m, 10m, etc)
- Select the dashboards you want to add to the playlist. If you added a tag like “kiosk” in your dashboard properties, you can use that tag to add all relevant dashboards at once.
Step 5: Test it out!
In Grafana, go to Dashboards > Playlists, and click Start Playlist > TV mode or Kiosk mode. There are different versions of kiosk mode; pick the one that looks best for your screen. Most web browsers have a fullscreen mode, which hides the extra toolbars and menus. You can bookmark these modes in your browser for easy access later.
If you added the ?$__to macro to the end of your image URLs, then Bob or Suzie should see their new pictures reflected on the dashboard on the next panel load. Otherwise, you may have to restart the kiosk browser or clear its cache every time they update something.


Comments